Nanobody Aggregation Score Calculation
Start your analysis now!
The nanobody aggregation score pipeline is publically available at xyna.bio. To use it, simply create an account, and you’ll find the Nanobody Aggregation Score Calculation pipeline ready for you in the Store Tab.
This pipeline enables users to predict nanobody aggregation properties starting from VHH FASTA sequences. It is based on the nanobody aggregation scoring method described in Geyer et al., 2025.
Reference:
Geyer, F. K., Borbeck, J., Palka, W., Zhou, X., Takimoto, J., Rabinovich, B., Reifenhäuser, B., Friedrich K. & Kolmar, H. (2025). Computational Prediction of Single-Domain Immunoglobulin Aggregation Propensities Facilitates Discovery and Humanization of Recombinant Nanobodies. Antibodies 2025, 14(3), 73.https://doi.org/10.3390/antib14030073
This method considers:
-
exposed surface hydropathy
-
intramolecular hydrophobic interaction
-
instability index
of the FR2 region as well as the residue 118 at the FR4 interface.
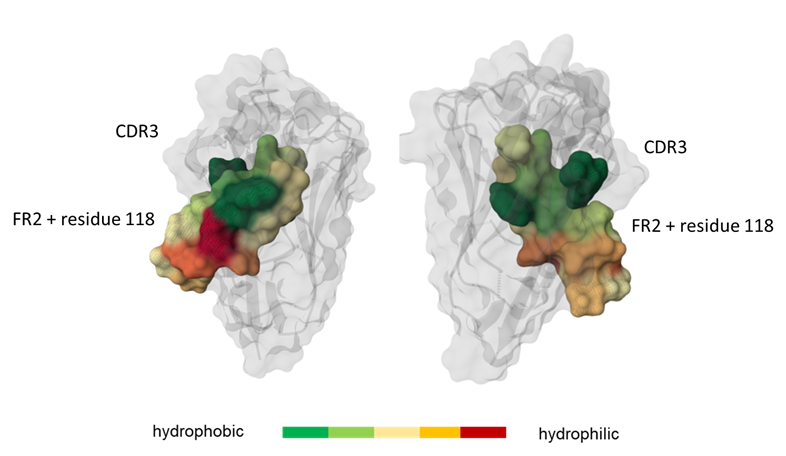
Figure 1: Graphical representation of the framework region 2 (FR2) and residue 118. Region highlighted according to the hydrophobicity of its residues: green for hydrophobic ones and red for hydrophilic ones. Cartoon and molecular surface representation created using Mol * (https://doi.org/10.1093/nar/gkab314). Figure adapted from Geyer et al., 2025.
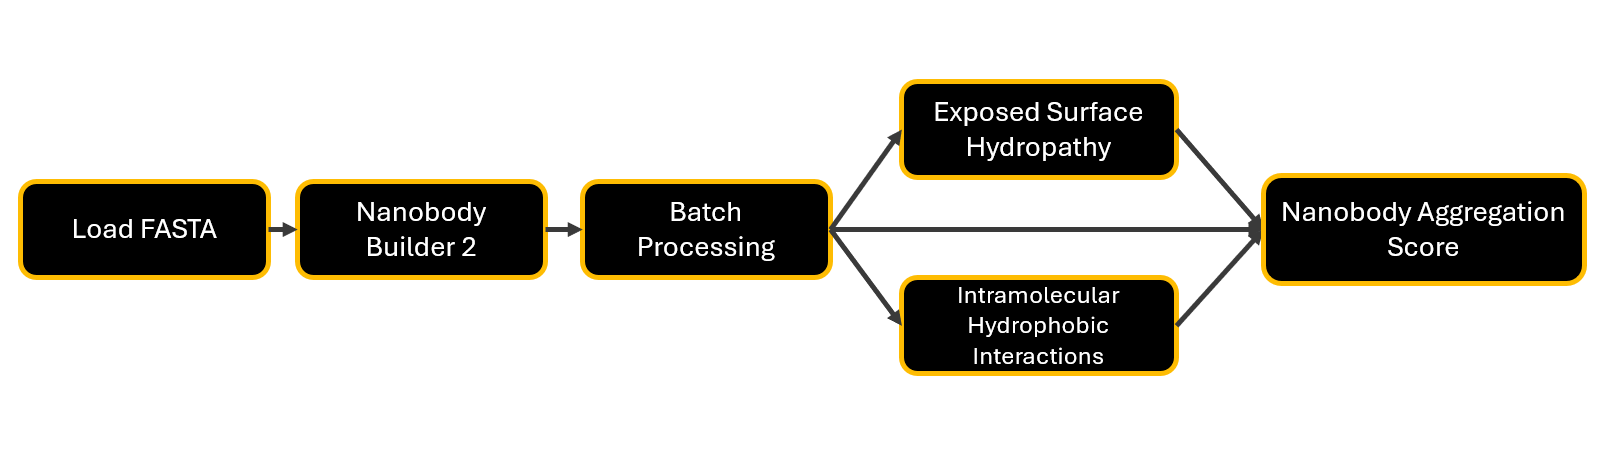
Figure 2: Schematic overview of the xyna.bio nanobody aggregation score calculation pipeline. Disclaimer: the instability index calculation is integrated in the Nanobody Aggregation Score node
1. Load FASTA
Begin by loading a FASTA or MultiFASTA file containing VHH sequence(s). The FASTA headers should only contain the ID/name of the corresponding VHH sequence.
Example:
>Sequence_1
QVQLQESGGGSVQAG...

>Sequence_2
QVQLQESGGGSVQAG...

>Sequence_3
QVQLQESGGGSVQAG...
2. NanobodyBuilder2
NanobodyBuilder2 is a tool for predicting the 3D structure of nanobodies from their amino acid sequence using a deep learning model. It numbers the created .pdb files using ANARCI.
Reference:
Abanades, B., Wong, W. K., Boyles, F., Georges, G., Bujotzek, A., & Deane, C. M. (2023). ImmuneBuilder: Deep-Learning models for predicting the structures of immune proteins. Communications Biology, 6(1), 575. https://doi.org/10.1038/s42003-023-04927-7
Browser application: NanoBodyBuilder2
Input
- Sequences: A .fasta file containing the sequence(s) of prospective nanobodies to be analysed.
Input Parameters
- Numbering Scheme: The ANARCI numbering scheme used. Default (and recommended for nanobodies) is IMGT numbering.
Output
- Nanobody Structures: A list of predicted 3D structures in .pdb format. This output should be directed into a Batch node to process and calculate the aggregation score of each nanobody in a single run. To maintain robustness, the Batch node is also needed if only one nanobody is analyzed.
- Numbered Sequences: The numbered sequences according to the selected numbering scheme as .csv file. The columns are the indices allocated to the residues of the sequences provided in the input file. A missing cell or number indicates a gap. For context and interpretation, see ANARCI.
3. Intramolecular Hydrophobic Interactions
This node fetches precomputed intramolecular hydrophobic interactions directly from Mol*'s built-in analysis module, accessing the residue-level hydrophobic contacts derived from Mol*’s spatial analysis routines, which incorporate atomic proximity, physicochemical properties, and interaction types as visible in the interactive structure visualization in Mol*. The output consists of per-residue hydrophobic interaction counts, corresponding to the number of unique, spatially-accessible hydrophobic contacts each residue forms with others.
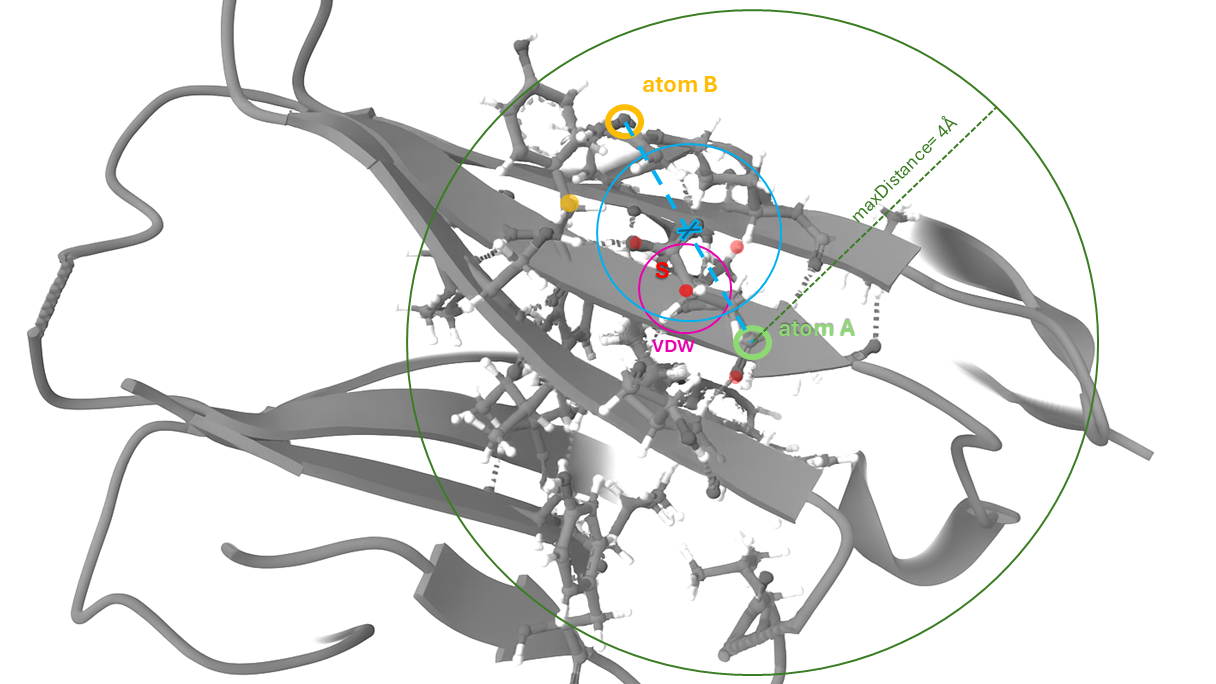
Figure 3: Graphical scheme of the Mol* spatial analysis to calculate hydrophobic interactions. Mol* checks if two hydrophobic atoms are close enough (distance < threshold) and if nothing is blocking the direct path between them (no other atom is in the way). If both are true, it records a hydrophobic interaction between those atoms. See below for further details.
Detailled information on Mol*'s internal calculation logic:
1. Identify Hydrophobic Atoms
First, for each residue, all neighboring residues within a 5 Å radius are considered (this corresponds to the Mol* visual components "Target" and "Surrounding", when focusing the view on an individual residue). Within each target residue: If both atoms A and B are hydrophobic, the algorithm checks whether they are close enough to potentially interact.
2. Set a Maximum Distance
There is a
maxDistance threshold (default 4 Å) that defines how far apart hydrophobic atoms can be to still be considered as interacting.
3. Check the "Line of Sight"
The algorithm needs to make sure there’s a clear "line of sight" (an unobstructed path) between the two atoms. This is done by checking intermediate points (S) that might block the interaction.
4. Filtering Points S
For each point S (potentially blocking atoms, here shown in red), Mol* runs a test (
checkLineOfSight).The interaction between Atom A and B (here in blue) is only accepted if all points S meet the following conditions:
- S does not exist or is not a real atom.
- S is outside the maxDistance (here in green) sphere (too far away to interfere).
- S is not atomic (e.g., a Gaussian or sphere).
- S is a hydrogen atom ("invisible" in this context).
- The van der Waals (VDW; here in pink) radius of S does not cover the midpoint between A and B.
- S is at the center of a functional group (very close to one of the hydrophobic atoms).
5. Result: Count as Interaction If Path is Clear
If all points pass the test, the path is unobstructed, and a hydrophobic interaction is counted between Feature A and Feature B.
Reference:
Sehnal, D., Bittrich, S., Deshpande, M., Svobodová, R., Berka, K., Bazgier, V., ... & Rose, A. S. (2021). Mol* Viewer: modern web app for 3D visualization and analysis of large biomolecular structures. Nucleic acids research, 49(W1), W431-W437.https://doi.org/10.1093/nar/gkab314
Input
- Nanobody Structure: A single .pdb formatted structure file. In the context of nanobodies and anitbodies, the structure should be annotated with ANARCI. It can, for instance, be the output of the ANARCI PDB node or a batch item of the NanobodyBuilder2 Output.
Input Parameters
- Cutoff Distance: The distance in Angstrom up to which two residues will be determined to have an interaction. Set it to 4 Å to reproduce the parameter settings of Geyer et al., 2025.
Output
- Hydrophobic Interactions: A list containing the number of interaction partners for each amino acid of the given structure.
4. Exposed Surface Hydropathy
A large factor in aggregation is the total amount of exposed surface area hydropathy of the former VH-VL interface, called FR2 region (residue 39-55 based on IMGT numbering). This node determines the exposed surface hydrophobicity by calculating the mean product of the exposed surface area (Shrake-Rupley algorithm) and hydrophobicity of each amino acid (Wimley and White hydrophobicity scale). A more negative result for a particular residue reflects more hydrophilic exposed surface. A more positive result reflects more hydrophobic surface.
References:
Shrake-Rupley algorithm: Shrake, A., & Rupley, J. A. (1973). Environment and exposure to solvent of protein atoms. Lysozyme and insulin. Journal of molecular biology, 79(2), 351-371.https://doi.org/10.1016/0022-2836(73)90011-9 (Implementation: https://github.com/biopython/biopython/blob/master/Bio/PDB/SASA.py)
Hydrophobicity scale: Wimley, W. C., & White, S. H. (1996). Experimentally determined hydrophobicity scale for proteins at membrane interfaces. Nature structural biology, 3(10), 842-848.https://doi.org/10.1038/nsb1096-842
Input
- Nanobody Structure: A single .pdb file containing a nanobody structure annotated with ANARCI. It can, for instance, be the output of the ANARCI PDB node or a batch item of the NanobodyBuilder2 Output.
Input Parameters
- Molecule Radius: Radius of the molecule that is used to probe if a residue is exposed to the surface. Default is the radius of a water molecule (1.4 angstrom).
- Sample Points: Number of sample points at which the surface will be probed. A higher number might increase accuracy but also increases runtime. It is recommended to start with 100 (default), if not stated otherwise.
Output
- Exposed Surface Hydropathy: A list containing the hydropathy of the exposed surface for each amino acid of the given structure.
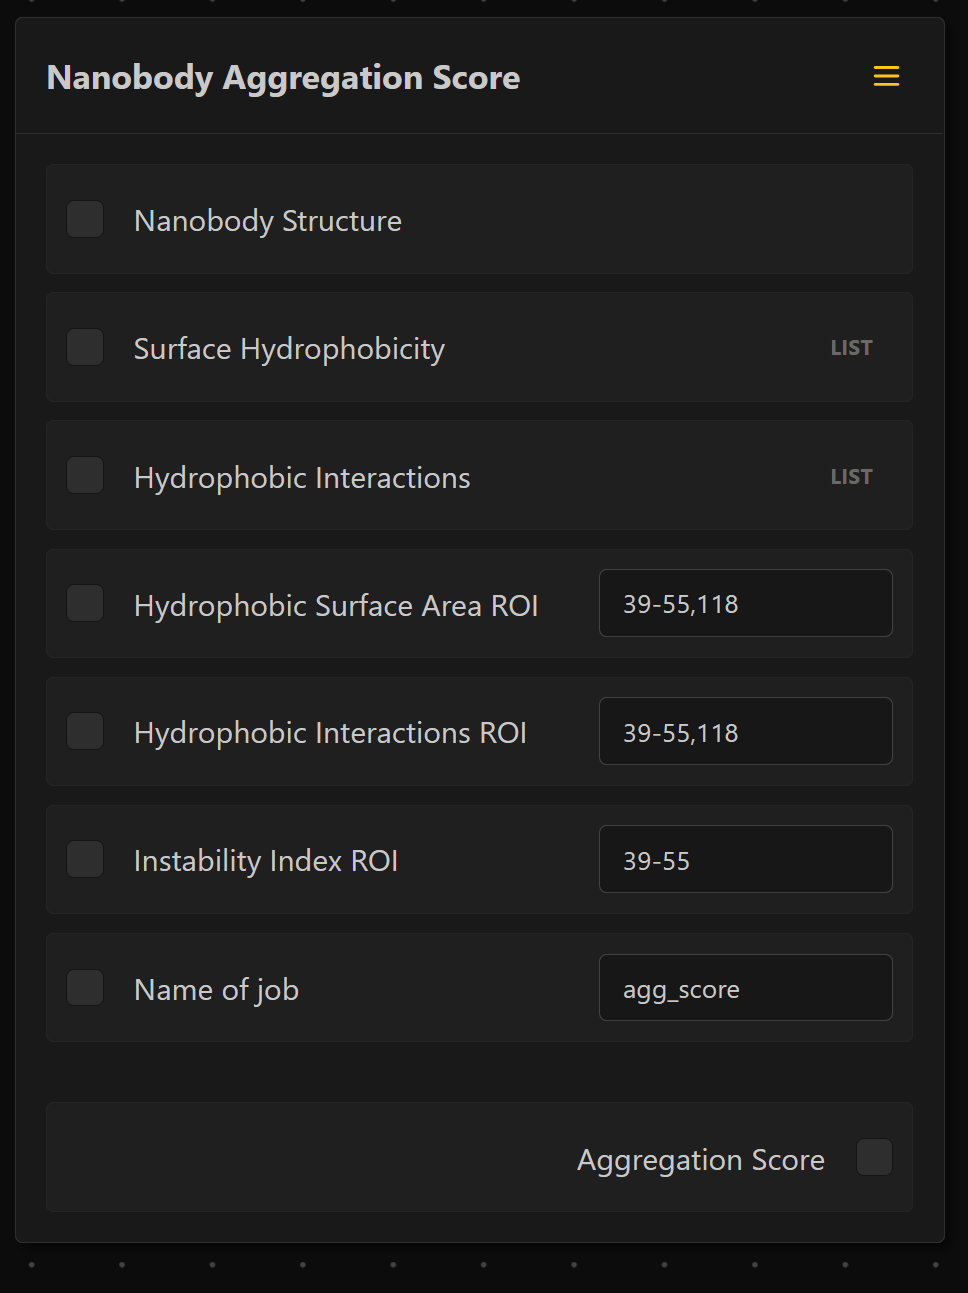
5. Nanobody Aggregation Score
This is the final pipeline node, calculating the aggregation score for a given nanobody. It follows the formula laid out in Geyer et al., 2025 to predict the likelihood of said nanobody aggregation based on the exposed surface area hydropathy, the internal hydrophobic interactions and the inherent (in-)stability of the FR2 region.
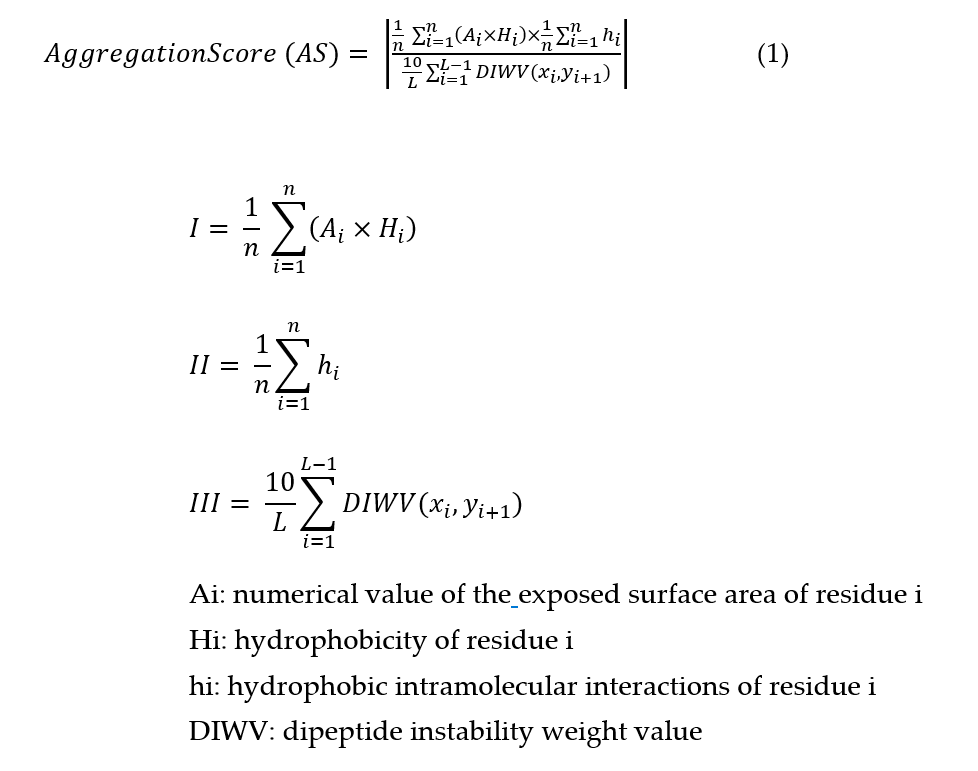
Figure 4: Mathematical formula for the aggregation score behind the Nanobody Aggregation Score node. (I) the hydrophobicity of the conserved immunoglobulin domain interaction interface (FR2 + residue 118), (II) the mean hydrophobic intramolecular interactions possible for each residue in a radius of 4 Å of the contact interface (FR2 + residue 118), and (III) the instability index of FR2. Adapted from Geyer et al., 2025.
Input
-
Nanobody Structure: A single .pdb file containing a nanobody structure annotated with ANARCI. It can, for instance, be the output of the ANARCI PDB node or a batch item of the NanobodyBuilder2 Output.
-
Exposed Surface Hydropathy: A list containing the hydropathy of the exposed surface for each amino acid of the given structure. Output of the Exposed Surface Hydrophobicity node.
-
Hydrophobic Interactions: A list of the number of interaction partners for each amino acid of the given structure. Output of the Intramolecular Hydrophobic Interactions node.
Input Parameters
- Exposed Surface Hydropathy ROI: Region of Interest (ROI) for the exposed surface hydropathy on which the analysis should be performed. The selected default is the FR2 region and residue 118 (according to IMGT numbering). The indices should be provided according to the used ANARCI numbering scheme. Separate the indices by '-' for ranges and by ',' for single indices (e.g.: 39-55,118 for the default region). If the field is left blank, the entire nanobody is used.
- Hydrophobic Interactions ROI: ROI for the hydrophobic interactions on which the analysis should be performed. Again, the selected default is the FR2 region and residue 118 (according to IMGT numbering). The indices should be provided in the same format as stated for the Surface Area Hydropathy ROI parameter.
- Instability Index ROI: ROI for the instability index on which the analysis should be performed. The selected default is the FR2 region (according to IMGT numbering). The indices should be provided in the same format as stated for the Surface Area Hydropathy ROI parameter.
Reference: Guruprasad, K., Reddy, B. B., & Pandit, M. W. (1990). Correlation between stability of a protein and its dipeptide composition: a novel approach for predicting in vivo stability of a protein from its primary sequence. Protein Engineering, Design and Selection, 4(2), 155-161. DOI: https://doi.org/10.1093/protein/4.2.155
- Numbering Scheme: Numbering scheme to number the structures according to ANARCI. Default (and recommended for nanobodies) is IMGT numbering. If the Nanobody Builder 2 node was used to create the PDB structures, make sure to use the same numbering scheme.
- Job Name: A name for the given job that is used to aggregate the results of one batch into one output file. To produce a correct output, each run should be named differently and the name is not allowed to be empty.
To reproduce the settings from from Geyer et al., 2025, select the following regions of interest and the IMGT numbering scheme:
Output
- Aggregation Score: The final aggregation score of each nanobody in the batch and its sub-components, stored as one .csv file.
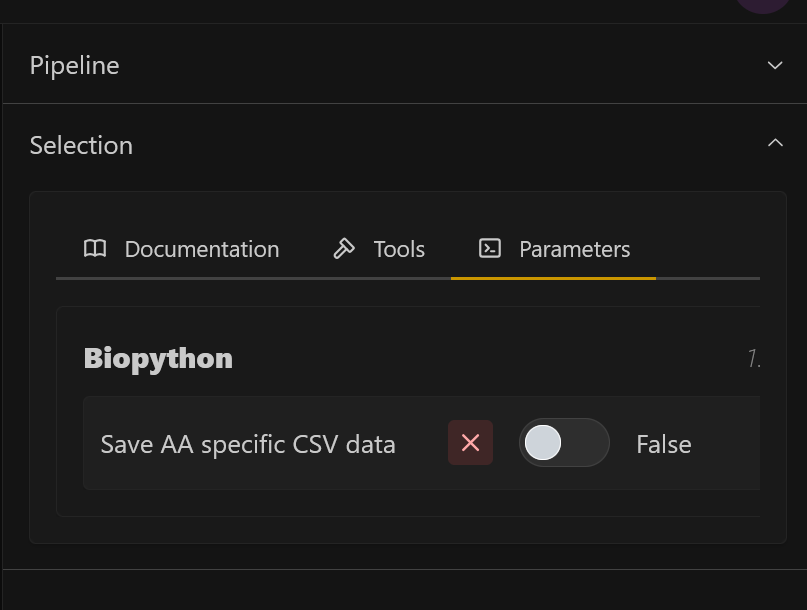
Pipeline Add-ons
1. Download animo acid specific values
Open the side panel, and toggle Save AA specific CSV data, to additionally store the amino acid values for the interactions, surface area, and hydrophobicity.
Disclaimer: The columns of the output files are currently hard coded, depending on the selected numbering scheme. For this reason, insertions and deletions are likely not truthfully represented. For short sequences, many columns are empty, while very long sequences might be reflected incorrectly. An improved version is under construction. For a correct representation of the sequence numbering, refer to the Numbered Sequences output of the Nanobody Builder 2 node.
2. Visualize individual nanobody structures:
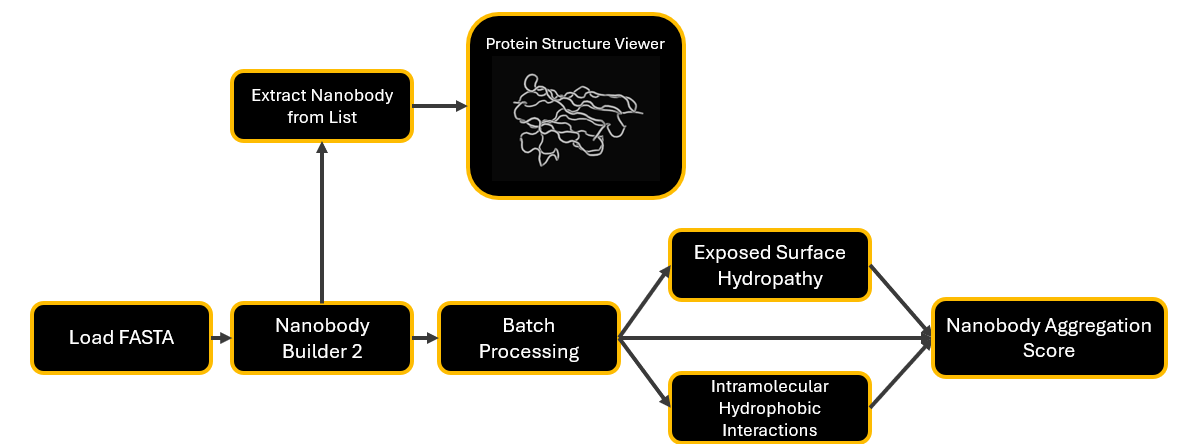
Figure 5: Extend the pipeline by adding an extraction node, connected to the Protein Structure Viewer to select and open individual structures in Mol*.
Extract Nanobody from List
This node extracts a nanobody structure by its ID from a list of nanobody structures as .pdb files.
Input
- Input List: The list of .pdb files containing nanobody structures. Usually, this list is created by the Nanobody Builder 2 node.
Input Parameters
- Nanobody ID: The ID of the nanobody to be extracted from the list. It must match the name given in the input .fasta file of the Nanobody Builder 2 node. The ID can be provided in upper- or lowercase.
Output
- Extracted Nanobody: Reference to the .pdb file of the extracted nanobody. It can directly be linked to the Protein Structure Viewer node.